Need powerful KPIs for your Engineering?
Get our free Vendor Document Register tool
and nail down those transmittals!
try the Controlroom on-line
A complete Engineering Document Management tool
adopted by SMBs in the O&G, EPC and Energy industries
(Scroll this frame for detailed instructions.)
You can try the ControlRoom now, using this data template:
After copying the data into the frame, scroll to see the graph.
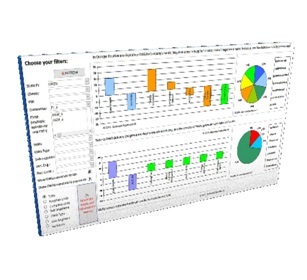
How to read the Graph:
- The Blue bars
refer to drawings still to be issued. They count the days to the required first issue. Negative values are days "to" first issue, Positive values are first issue's delay days - The Red bars
refer to drawings under revision. They count the days since the document is in the hands of one of the party. Negative values are days since drawing has returned, Positive values are days since drawing has been sent - The Green bars
refer to Final drawings. They count the days since the drawing has been Finalized. Negative values are drawings returned Final, Positive values are drawings sent as Final - The Dark Red stacked bars
appear when the revision allowed time has been surpassed.
